Single Property SLR Risk Report - Insurance Lens

Property Risk Assessment - A Large Coastal Front Hotel

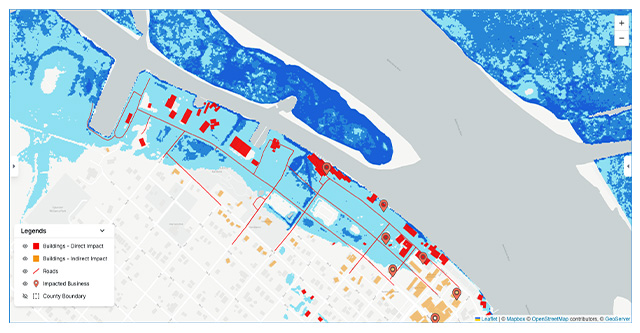
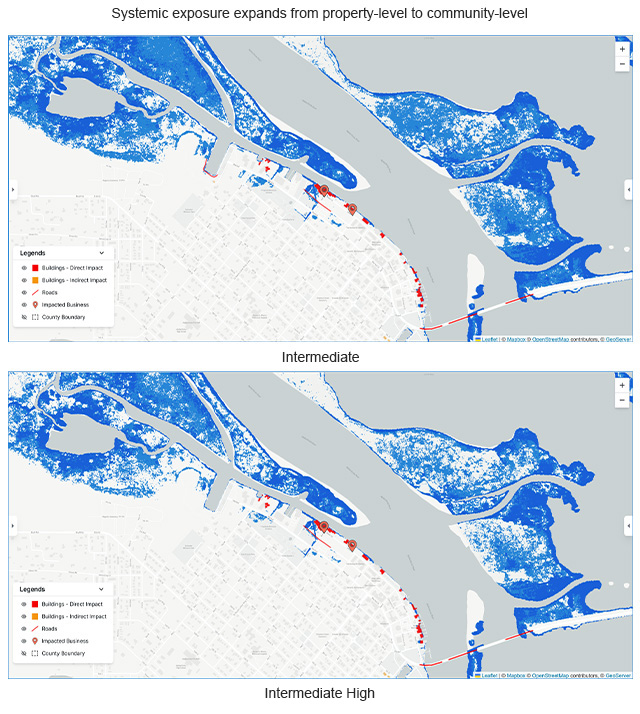
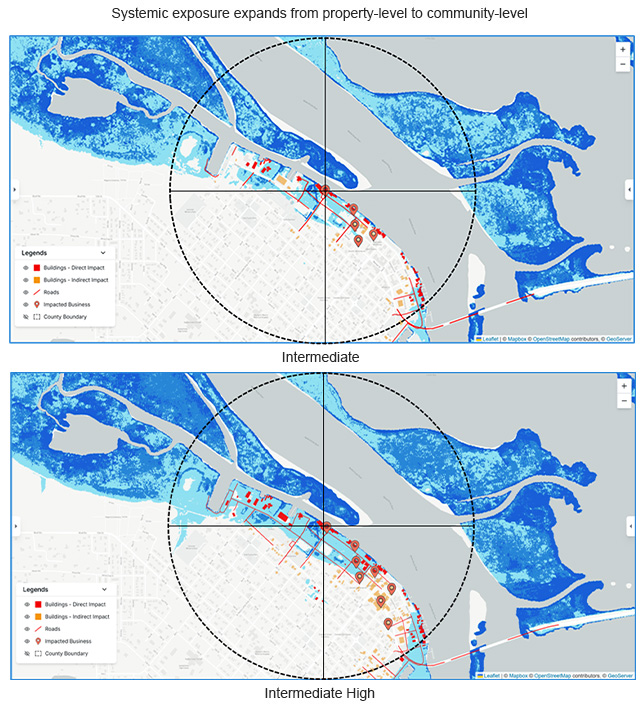
Our client, a leading insurer with a portfolio of coastal properties in Florida, faced growing uncertainty in quantifying the impact of sea level rise (SLR) on individual assets. Traditional flood maps offered broad regional exposure but failed to capture the granularity of building-level risk and indirect disruptions, such as blocked access roads. Without this precision, underwriting decisions carried significant blind spots, and compliance with climate-risk reporting frameworks remained a challenge.

The client sought a solution that would:
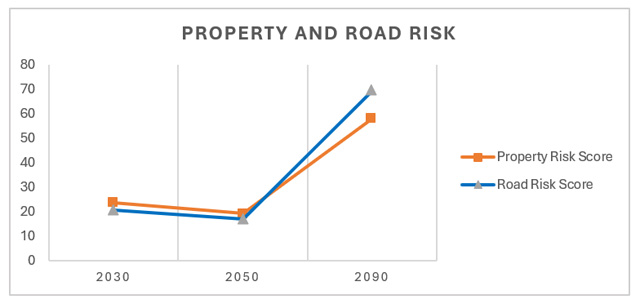
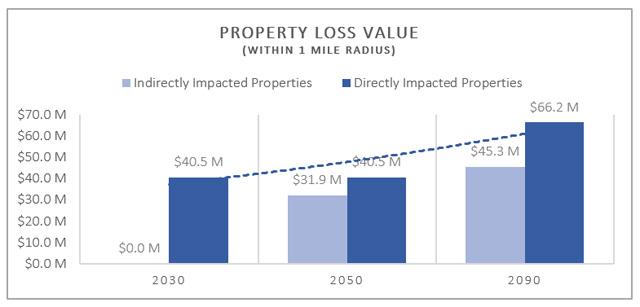
Provide asset-specific insights on SLR exposure across multiple time horizons (2030, 2050, 2090).
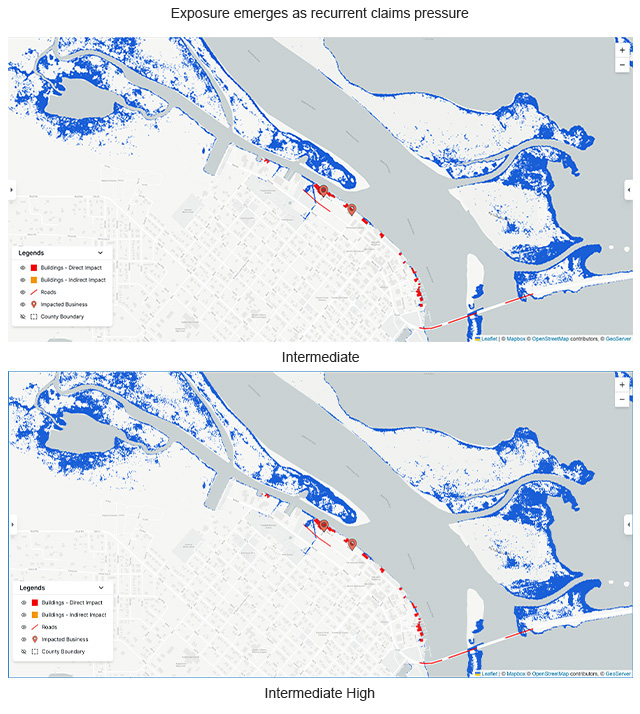
Differentiate between direct impacts (building inundation) and indirect impacts (loss of accessibility, community-level vulnerabilities).
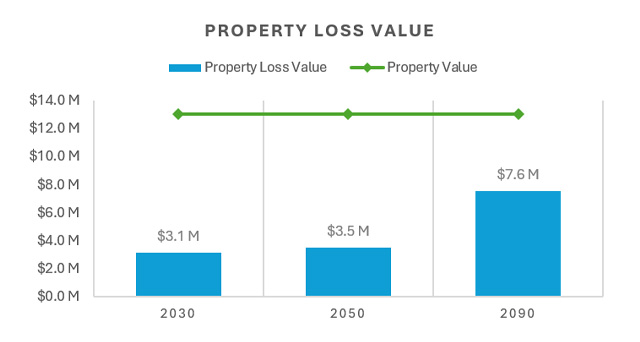
Support smarter underwriting and pricing by integrating climate risk into financial loss estimates.
Deliver outputs that are transparent, defensible, and aligned with regulatory and disclosure requirements (e.g., NAIC climate scenarios).
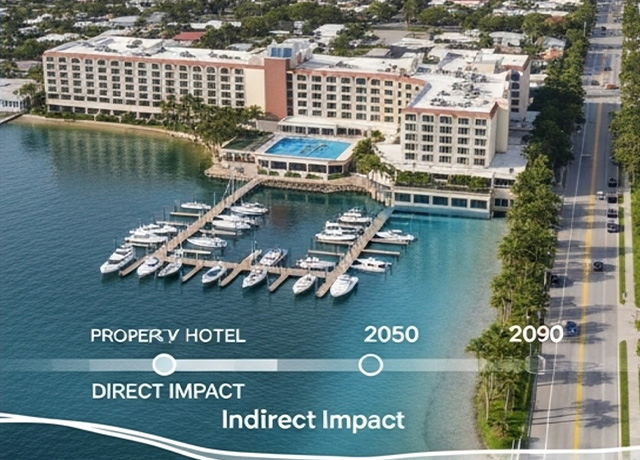
Card image cap

*Property NameCoastal Haven Resort & Marin
Location123 ABC Street 122, Apalachicola, Florida
Occupancy ClassCommercial
* To protect client confidentiality, the property images and address shown here are illustrative only. All risk insights, analysis, and metrics are based on real AssetRx output.
Solution Overview:

Using AssetRx, we generated a SLR Impact Report that blends geospatial modeling, climate projections, and financial metrics. For the property under study, maps visualized inundation risk under Intermediate (moderate) and Intermediate-High (severe) sea level rise scenarios, highlighting year-by-year exposure. The analysis quantified:

Inundation Projection203020502090
Intermediate
Intermediate High


Property is inundated as early as by 2030 in both intermediate and intermediate high scenarios.
Risk and losses escalate by 2090, with increasing risk score ~58/100.
46-50% of the surrounding area (1 Mile s) will be flooded by 2090, indicating severe local impacts
Infrastructure Impact (2090): Almost all road (5) providing access to the property will be flood

Card image cap


33.61


Total Value Exposed

$ 13.1 Million

Potential Probable Maximum Loss (PML)
Average Annualized Loss

$ 4.4 Million

Claims Burden Estimate
SLR Impacted Area

50 %

In 1 Mile Radius by 2090
Direct Impact Waterline at property footprint → partial damage.
Indirect Impact Road access disruptions increase claims frequency.
Underwriting Insight Nuisance flooding can escalate to attritional claims.

Near-term risks (2030) carry a higher weight than long-term risks (2050 and 2090). Risks occurring sooner are more critical for decision-making than those far in the future.

Card image cap

Both climate scenarios (moderate & Severe) yield identical risk scores, indicating that even moderate climate change will lead to serious repercussions.
The direct impact on buildings remains moderate initially, but the indirect impact from road flooding greatly escalates by 2090, impacting access.
Property will face flooding by 2030, reflecting both direct and indirect effects, which suggests that urgent measures are required.
In general, risk scores escalate over time, with 2090 presenting the most significant effects, highlighting the importance of resilience planning.

Card image cap

Direct Risk Inundation affecting structure & foundation.
Indirect Risk Community access roads submerged.
Underwriting Insight Higher frequency & severity → reinsurance reliance increases.


Card image cap

Both property and road losses increase significantly by 2090, driven by escalating sea level rise and widespread inundation.
Road loss contributes heavily to economic disruption by 2090, reflecting severe damage to accessibility and infrastructure.
Combined projected losses exceed $7.6 million by 2090, emphasizing the urgent need for long-term investment in resilience.
Loss estimates are based on current-year NRI-derived asset values. Property value appreciation and depreciation due to building age or market fluctuations have not been accounted for in this analysis.

Card image cap

Direct Risk Property inundated → structural damage unavoidable.
Indirect Risk Service disruption → Business Interruption claims rise.
Underwriting Risk Event-driven & chronic risks converge → portfolio loss potential.

Card image cap


Properties within 1-mile radius exposed to SLR risk
155 Property Impact
Both scenarios show a sharp rise in community exposure, with over 150 buildings at risk by 2090 within a 1-mile radius
8.97
Miles
Road Loss
Road accessibility is expected to decline significantly by 2090, impacting community connectivity and resilience compounding indirect risk to all near by properties
1.32
Sq. Miles
Area Inundation
Flooded land area grows steadily, reaching 1.32 sq mi by 2090, signaling deep inland penetration of sea water

Card image cap

Conclusion

Key Insights

Early Onset of Risk The property faces SLR-driven flooding by 2030, indicating that climate risks are not distant threats but immediate concerns. Even under moderate scenarios, the site is affected in the near term.
Escalating Impact Risk and impact intensify over time – what is a moderate risk in 2030 grows to extreme levels by 2090. Projected loss jumps from ~$3M to ~$7.6M, reflecting the compounding damage potential as sea levels rise.
Infrastructure Vulnerability The roads serving the property increasingly flood, with 5 key segments lost by 2090. This escalating infrastructure exposure means the property could be isolated or rendered inaccessible well before it’s completely lost, compounding the functional risk.
Widespread Surroundings Impact By 2090, the surrounding community (within 1 Mile radius) is largely underwater (up to ~50% area inundated). This suggests not only property-specific issues but broader socio-economic impacts, including potential population displacement and loss of utility services in the area.


Long-term Resilience Strategies
Hard Infrastructure Solutions Seawalls, flood barriers, and stormwater management improvements. Community-Level Resilience Emergency planning, public investment in flood defense systems
Soft Adaptation Strategies Elevating structures, managed retreat options, nature-based defenses. Regulatory and Financial Preparedness Climate risk insurance, real estate market adaptation, and zoning updates.